M-TEST: XRD and point counting

Published 20 August 2024


Arthur Harrisson compares microscopic point counting and Rietveld XRD analysis, and looks at the possible causes of different outcomes in these techniques.

Figure 1: stepping stage for microsocopic point counting

For much of my career I have been examining clinker samples from many countries for various clients. One of the measures I perform in a standard examination is a point count to determine the proportions of the silicate phases and the matrix.

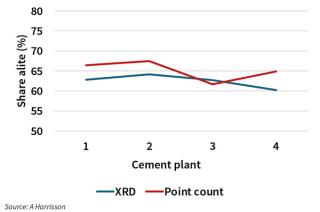
A previous article in ICR discussed the differences between the Bogue calculation and the results from other measurements for clinker phases. The main reason for differences is that the Bogue method assumes that pure crystals of C3S, C2S, C3A and C4AF are present in clinker while in practice the compositions vary from this, largely due to the presence of minor elements within each of the phases.  Several cement plants that submit samples for microscopical analysis also provide the results for the XRD analysis for the same samples. I have noticed over the years that the optical point count values often differ by a few per cent from the XRD results and have wondered what the significance might be of the differences. From my examinations in most cases (not all) the point count value for alite is a little higher that that from XRD. Figure 1 shows the average values over extended periods for four locations from each of which at least 20 samples had been examined. For three of the locations the microscopic point count alite percentages were higher on average than the XRD alite and in the other the value was slightly lower for the XRD. As well as differences between the point count and Bogue, and between the XRD and Bogue, it is also useful to look into the differences between point count and XRD results starting with the procedures used for each method.

Microscopic point counting

The samples for microscopic examination are taken as grab samples at a time when all relevant details of the production are known. These include the process type, whether a wet or dry or semi-wet or semi-dry process, the fuel mix and firing position, the kiln feed composition, the clinker composition and, when available, the clinker XRD analysis. 

From the clinker sample a sub-sample of about 250g is taken either with a riffle box or by coning and quartering. This sub sample is crushed and sieved to between 1-5mm of which about 5g is placed in a circular plastic mould 25mm across and embedded in a plastic resin under vacuum. It is the practice to make two such specimens from each batch. When the resin has set the specimen is ground and polished to expose a flat surface through the clinker pieces. This surface is etched with a mix of nitric acid with isopropyl alcohol (nital) to produce colours in the clinker minerals when examined under the microscope, which aids phase identification. 

In this writer’s case, the microscope used for general examination and photography is a Leica DMLM reflected light microscope equipped with a Canon EOS 600D camera. The phase proportion measurement and the crystal sizing are made using a Leitz Orthoplan microscope and a Petrog4 system.

Point counting is carried out using a mechanically-driven microscope stage, this is driven from a computer that can be programmed to search over the whole specimen surface in pre-determined steps. After each step the mineral lying beneath the cross wires is recorded and the stage moves to the next point which is recorded and so on.

Figure 1:alite percentage by XRD and point count at four locations

Rietveld XRD analysis    

Many cement plants have, over the past few years, been equipped with XRD machines which determine the crystal structures of minerals and use known mineral characteristics to calculate the proportion of each mineral present. In the past it has been difficult to obtain sufficiently clear XRD patterns from clinkers to produce accurate results, due largely to peak overlap. In recent years the Rietveld refinement technique has been introduced. This uses a nonlinear least squares fit to minimise the differences between the entire set of observed peak intensities and the peaks calculated from a crystal model. This requires minimising the sum of the weighted, squared differences between observed and calculated intensities at every step in a digital powder pattern and the method requires knowledge of the approximate crystal structure of all phases present in the specimen.

The sample for examination needs to be ground, ideally to approximately 5µm or less. In a review of the use of the Rietveld procedure for examining cement clinkers and hydration products, Aranda et al3 point out that for CuKa radiation in Brag-Brentano configuration, the relative standard deviation of the measured intensity due to particle statistics is less than a few per cent when the particle size is smaller than 5µm. However, the statistical error increases rapidly if the particle size is bigger than about 10µm.

As well as fineness it is important that all faces of the crystals should be reached by the X-ray beam, so preferred orientation must be avoided. In cement clinker samples the main cause of preferred orientation of alite crystals is in the preparation of pressed pellets. The preparation of samples can be either as powders or as pressed pellets and it is understood that many cement plant laboratories use pressed pellets.

In the paper the use of SEM-EDS techniques was described, but EDS analysis of only one of the eight clinkers examined in the programme was reported. The eight clinkers comprised four ordinary cement clinkers and four high alumina ratio and high silica ratio clinkers which might be described as white or cream cement clinkers. The clinker for which the SEM-EDS result was quoted was one of the whiter clinkers. The Bogue calculation for this clinker indicated three per cent ferrite phase and the optical microscopy point count produced an answer of 2.7 per cent. The Rietveld analysis showed no ferrite phase at all, but it did show 8.7 per cent orthorhombic aluminate and 3.7 per cent cubic aluminate. The authors suggested that the cubic aluminate may have been mistaken for ferrite phase by the microscopist.

Possible causes of different result

Shortage of matrix with XRD

A striking difference from XRD for both the Bogue calculation and the point counts were the amounts of matrix reported. As described above ‘matrix’ for point counts often includes periclase and sulphates, but even when all of these phases are added to the aluminate and ferrite from the XRD results there has frequently been a shortfall of a few per cent compared to the Bogue or point counts. An example is shown as Table 1 in which the matrix value by XRD is the sum of the aluminate and ferrite phases plus periclase and alkali sulphates. It is noticeable that the shortfall in matrix minerals (and one per cent alite) compared to the point count is approximately made up by a higher proportion of belite. Incipient belite is usually present within the liquid phase and it is possible that the XRD finds minute belite crystals that microscopy cannot see. 

Other inclusions

The identification of inclusions in alite by microscopy is easily carried out but can be very difficult in belite in the course of a routine point count. Inclusions in alite are common and if the particle size of a sample for XRD includes alite crystals greater than about 10µm it is possible that the inclusions would be measured with alite. 

Missing phases in XRD standards
Frequently the alkali sulphates reported by XRD do not seem to accord with the alkali and sulphate in the chemical analysis after accounting for the presence of these in the other phases. It is possible that the normalising of the XRD results does not fully take into account the minor phases and therefore would give an exaggerated measure of the main phases. 

Volume percentage and weight percentage

The point count technique described gives a volume percentage of each phase while the XRD reports weight per cent. The mass densities of the main phases are known and it would be theoretically possible to convert the volume per cents to weight per cent. However, while the volume percentages of alite and belite have been measured, in most cases the proportions of the other phases have not been individually obtained, so the mass density of the matrix cannot be known. 

Representative counting

For point counting, sample preparation involves ensuring that the clinker fragments examined are representative of the clinker as a whole and standard procedures are followed. The ASTM for point counting includes the use of microscope reticles with multiple grid points rather than single cross hairs. Experience has shown that this can be impractical because of the inhomogeneity of many modern clinkers with multiple fuels. Ash from SRF fuels usually results in large clusters of belite crystals and a field of view may only include belite and matrix. Counting many crystals from the same cluster could lead to undue bias towards the belite count. It is preferable to use a magnification such that all crystals can be easily identified and such that the stage moves to a different field of view for each count.

Table 1: measured proportions of the phases by microsocopy, XRD and calculated by the Bogue calculation
  Alite Belite Free Lime Matrix
Microscopy 73 6 2.3 18
XRD 72 10 2.7 15
Bogue calculation 71 2 0.42 17

Other inclusions

The identification of inclusions in alite by microscopy is easily carried out but can be very difficult in belite in the course of a routine point count. Inclusions in alite are common and if the particle size of a sample for XRD includes alite crystals greater than about 10µm it is possible that the inclusions would be measured with alite. 

Missing phases in XRD standards

Frequently the alkali sulphates reported by XRD do not seem to accord with the alkali and sulphate in the chemical analysis after accounting for the presence of these in the other phases. It is possible that the normalising of the XRD results does not fully take into account the minor phases and therefore would give an exaggerated measure of the main phases. 

Volume percentage and weight percentage

The point count technique described gives a volume percentage of each phase while the XRD reports weight per cent. The mass densities of the main phases are known and it would be theoretically possible to convert the volume per cents to weight per cent. However, while the volume percentages of alite and belite have been measured, in most cases the proportions of the other phases have not been individually obtained, so the mass density of the matrix cannot be known. 

Representative counting

For point counting, sample preparation involves ensuring that the clinker fragments examined are representative of the clinker as a whole and standard procedures are followed. The ASTM for point counting includes the use of microscope reticles with multiple grid points rather than single cross hairs. Experience has shown that this can be impractical because of the inhomogeneity of many modern clinkers with multiple fuels. Ash from SRF fuels usually results in large clusters of belite crystals and a field of view may only include belite and matrix. Counting many crystals from the same cluster could lead to undue bias towards the belite count. It is preferable to use a magnification such that all crystals can be easily identified and such that the stage moves to a different field of view for each count.

Where is the iron?

The question posed in the title of the Crumbie paper ‘Where is the iron?’ raises broader issues concerning the matrix crystals in clinker. A third phase known as proto C3A has been found in eight out of fourteen clinkers examined by SEM-EDS5. This phase had been studied by Han and Glasser6 and has a composition somewhere between aluminate and ferrite. The XRD pattern is described as less well ordered than C3A. Proto C3A contains a higher proportion of Fe2O3 than C3A but is not generally identified by XRD. The presence of an iron-rich phase which is not known for the Rietveld refinement would inevitably lead to inaccuracies during a normalisation of results. 

References
1. HARRISSON, AM (2021) ‘Measuring alite quantity’ in: ICR, February, p48-50.
2. AMERICAN SOCIETY FOR TESTING OF MATERIALS (2012) Designation: C1356 − 07 (Reapproved 2012) Standard Test Method for Quantitative Determination of Phases in Portland Cement Clinker by Microscopical Point-Count Procedure. West Conshohocken, PA, USA: ASTM International. 
3. ARANDA, MAG, DE LA TORRE, AG AND LEON-REINA, L (2012) ‘Rietveld Quantitative Phase Analysis of OPC Clinkers, Cements and Hydration Products’ in: Reviews in Mineralogy and Geochemistry, 74, p169-209.
4. CRUMBIE A, WALENTA, G AND FULLMANN, T (2006) ‘Where is the iron? Clinker microanalysis with XRD Rietveld, optical microscopy/point counting, Bogue and SEM-EDS techniques’ in: Cement and Concrete Research, 36, p1542-1547.
5. HARRISSON, AM AND WINTER, NB (2001) ‘Flux phase compositions in Portland cement clinker.’ in: Proceedings of the 23rd International Conference on Cement Microscopy, Albuquerque, NM, USA. 
6. HAN, KS AND GLASSER, FP (1980) ‘Crystallization of the liquid phase development during clinkering’ in: Cement and Concrete Research, 10, p483-489.

This article was first published in International Cement Review – September 2024.