Cemtech MEA 2025
Cemtech Europe 2024
Cemtech ASIA 2024
Cemtech MEA 2024

Panel Discussion: Manufacturing low carbon cements
Panel Discussion: Cutting-edge technologies for low-carbon cement production
CO2 reduction combined with new concept for CI by-pass: Hans Jorgen Ibsen Nielsen, LV International Co Ltd (Thailand)
Process knowledge that creates instruments for AI - Dirk Schmidt, Kima Process Control (Germany)
Cemtech MEA 2024 Highlights
Cemtech Europe 2023
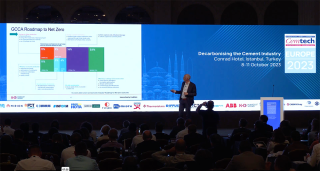
Technologies and solutions for the transformation of the cement industry: Matthias Mersmann, CTO, KHD Humboldt Wedag
Cemtech Europe 2023 Highlights video
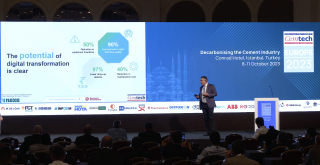
How to combine ML/AI and IoT for plant monitoring, control and optimisation: Juliano de Goes Arantes, Rockwell Automation (Switzerland) & Danijel Koren, NEXE dd (Croatia)
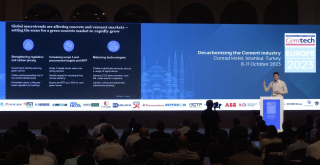
Cement industry business models through the net zero transition: Fabian Apel, Associate Partner McKinsey & Co (UK)
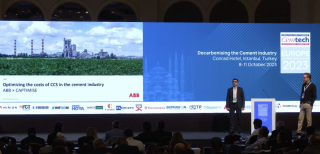
Optimising the costs of CCS: Ilten Karadag, ABB (Turkey) & Mattias Jones, Captimise (Sweden)
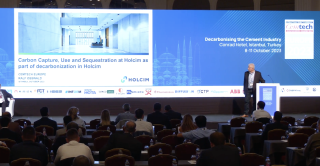
CCUS as part of decarbonisation at Holcim: Ralf Osswald, Holcim (Switzerland)
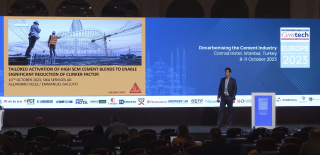
Tailored activation of high SCM cement blends to enable significant reduction of clinker factor: Alejandro Velez, Sika Services AG (Switzerland)
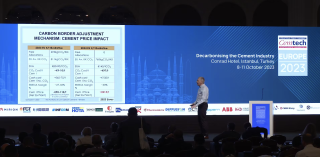
The portfolio of low carbon cements: Peter Hoddinott, Independent Consultant (UK)
Cemtech Asia 2023
Cemtech Asia 2023 Highlights Video
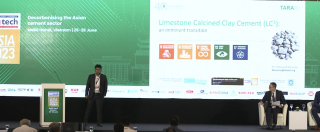
Limestone Calcined Clay Cement (LC3) – an imminent transition: Dr Debojyoti Basuroy, Development Alternatives Group
Alternative fuel resource utilisation and optimisation/reduction in specific heat: Vijay Arumugam, thyssenkrupp Polysius
Fuelling sustainable cement production – considerations for handling and firing alternative fuels: Nicolas Bec, FLSmidth (Denmark)
Advanced sustainability and carbon reduction plans including CCUS: Manasit Sarigaphuti, SCG Group (Thailand)
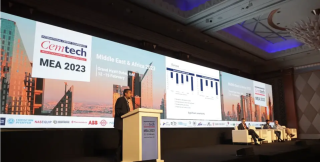
Cemtech MEA 2023
Cemtech Webinar 2022
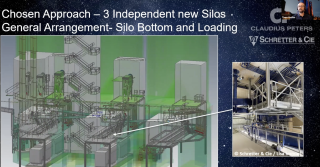
Cemtech Live Webinar: Bulk material handling for cement plants and terminals
Cemtech Live Webinar: Technologies for the production of low-carbon cement
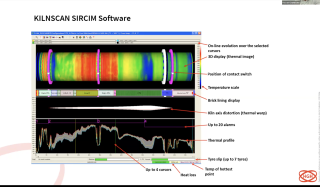
Cemtech Live Webinar: Process Optimisation
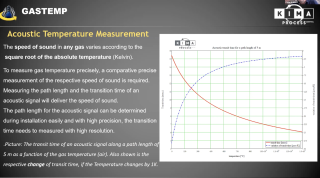
Cemtech Live Webinar: Technologies for emissions reduction
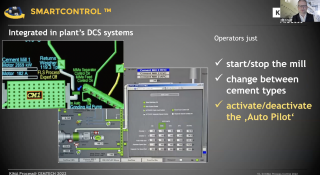
Cemtech Live Webinar: Optimising the grinding process
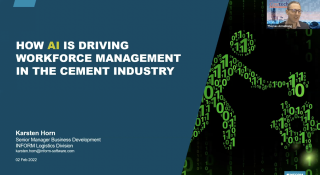
Cemtech Live Webinar: Digitalisation opportunities in cement plants
Cemtech Live Webinar: Cement Plant Maintenance & Asset Reliability
Cemtech MEA 2022
Cemtech Americas 2021
Cemtech Asia 2021
Cemtech Webinar 2021
Cemtech Live Webinar: Cement plant emissions monitoring & control
Cemtech Live Webinar: Advanced pyroprocessing and kiln control technologies
Cemtech Live Webinar: Digital Plant & Industry 4.0 Technology
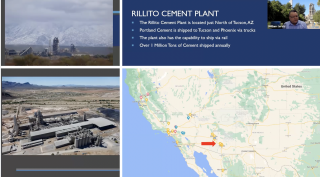
Cemtech Live Webinar: Energy reduction in cement plants
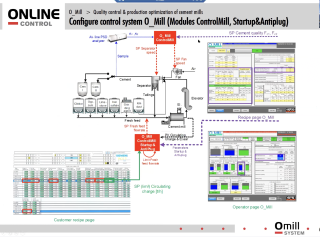
Cemtech Live Webinar: Quality Control for cement plants
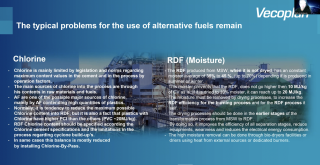
Cemtech Live Webinar :Alternative Fuels Best practice
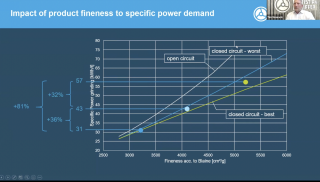
Cemtech Live Webinar: Mastering grinding technologies
Cemtech Live Webinar:Cement Plant Maintenance
Cemtech Live Webinar: Digitalisation & cement plant optimisation – Part 2
Cemtech Live Webinar: Digitalisation & cement plant optimisation – Part 1
Cemtech Live Webinar: Bulk materials handling for cement plants and terminals
Cemtech Webinar 2020
Cemtech Live Webinar: Cement and energy markets update
Cemtech Live Webinar: Clinker reduction technology
Cemtech Live Webinar: Conventional Kiln Fuels – preparation, storage and safety
Cemtech Live Webinar: Clinker reduction advances in Asia
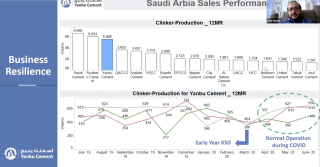
Cemtech Live Webinar: World Markets, Energy, Freight Update
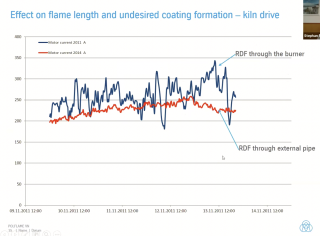
Cemtech Live Webinar:Optimise your kiln
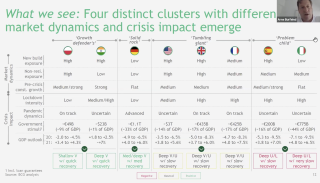
Cemtech Live Webinar: Planning for the post-covid recovery
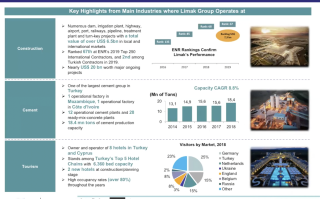
Cemtech Live Webinar: Global Cement Market Update
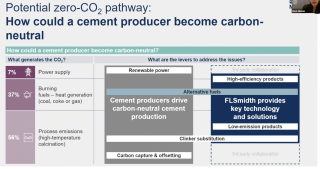
Cemtech Live Webinar: Best practice alternative fuels utilisation in cement plants
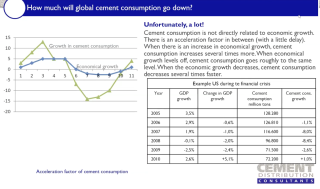
Cemtech Live Webinar: Impact of COVID-19 on the global cement trade
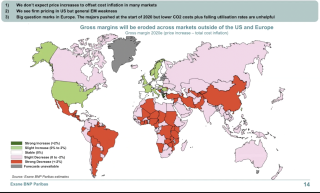
Cemtech Live Webinar- COVID-19: Global Cement Markets, Asia Focus and Plant Operations
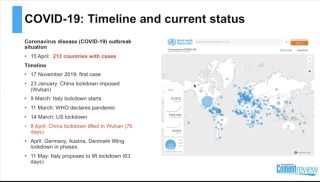
Cemtech Live Webinar: Impact of Covid19 on the cement industry
Cemnet Webinar: Cement Plant Maintenance
Cemtech MEA 2021
Cemtech Middle East & Africa 2021 - Session 1, Keynotes
Cemtech Middle East & Africa 2021 - Session 2, General Practice
Cemtech Middle East & Africa 2021 - Session 3, Market reports
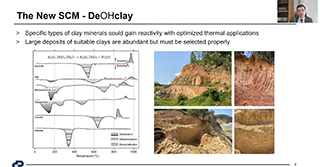
Cemtech Middle East & Africa 2021 - Session 4, Calcined clays
Cemtech Middle East & Africa 2021 - Session 5, African markets and financial analysis

Cemtech Middle East & Africa 2021 - Session 6, Pyroprocess and alternative fuels
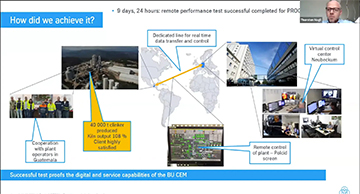
Cemtech Middle East & Africa 2021 - Session 7, Plant operations and optimisation
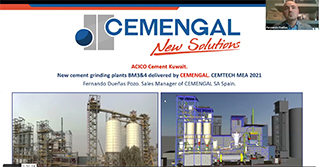
Cemtech Middle East & Africa 2021 - Session 8, Clinker reduction and grinding
Cemtech Virtual 2020
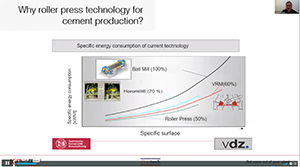
Cemtech Virtual Event - Decarbonising the cement industry, Session 8
Cemtech Virtual Event - Decarbonising the cement industry, Session 7
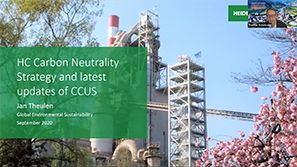
Cemtech Virtual Event - Decarbonising the cement industry, Session 6
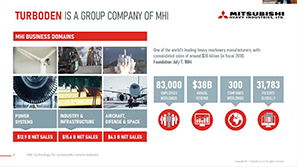
Cemtech Virtual Event - Decarbonising the cement industry, Session 5
Cemtech Virtual Event - Decarbonising the cement industry, Session 4
Cemtech Virtual Event - Decarbonising the cement industry, Session 3
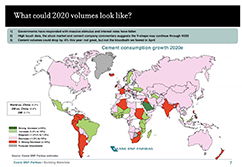
Cemtech Virtual Event - Decarbonising the cement industry, Session 2

Cemtech Virtual Event - Decarbonising the cement industry, Session 1
Cemtech Europe 2019
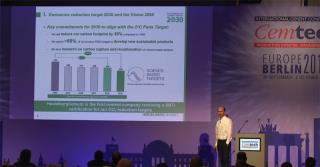
HeidelbergCement’s climate protection strategy and Vision 2050 - Peter Lukas, HeidelbergCement (Germany)
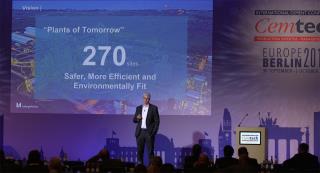
Laurent Seyler and Daniel Reiser, LafargeHolcim (Switzerland): Cement Plants of Tomorrow – Westküste 100
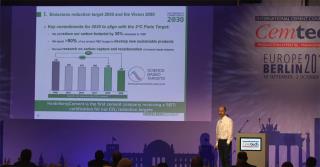
Peter Lukas, HeidelbergCement (Germany) - HeidelbergCement’s climate protection strategy and Vision 2050
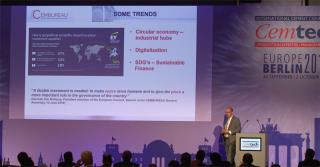
Koen Coppenholle, CEMBUREAU (Belgium) - A competitive European cement industry to drive down CO2 emissions along the value chain
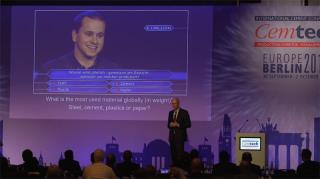
Martin Schneider, VDZ (Germany) - The German cement industry – market trends and technological development
Cemtech Asia 2019
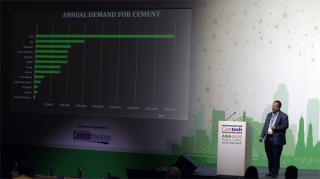
Nouzab Fareed, Pacific Cement (Fiji) - Cement in the South Pacific
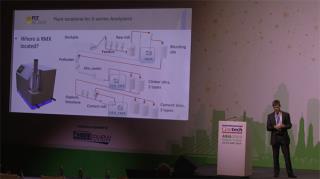
Peter Storer, FCT Combustion (Australia): Recent advances in raw meal control – a case study of clinker variability reduction
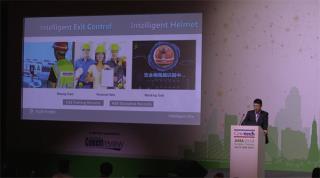
Daliang Chi, Sinoma CBMI Construction Co Ltd (China): Intelligent construction – a new EPC approach
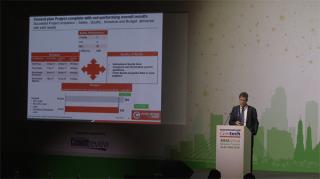
Aidan Lynam, Chip Mong Insee Cement Corp (Cambodia): Well underway towards a sustainable future.
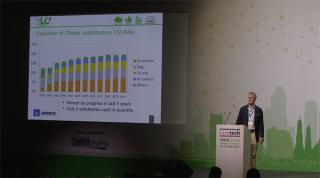
Laurent Grimmeissen, CEMENTIS GmbH (Switzerland) LC3: a breakthrough for the cement industry
Cemtech MEA 2019
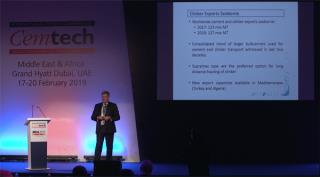
Javier Martinez Goytre, GlobBULK Consulting (Spain) - Clinker export considerations – light assets vs traditional shiploading facilities
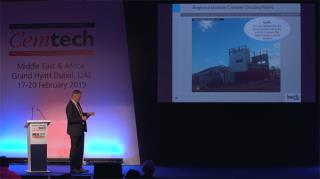
Olaf Michelswirth, Intercem Engineering GmbH - First European network of regional modular grinding plants
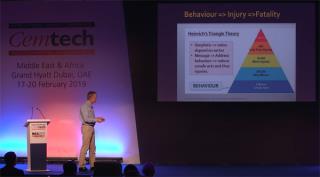
Peter Hoddinott, Peter Hoddinott Consulting (UK) - Health and safety leadership in cement manufacturing
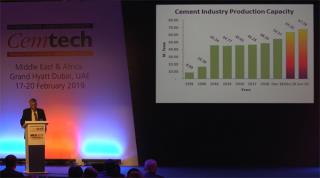
Arif Bashir, DG Khan (Pakistan) - Construction and commissioning of Pakistan’s largest cement plant
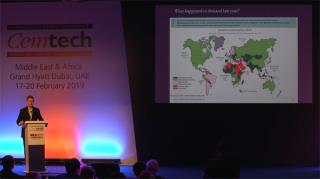
Paul Roger, Exane BNP Paribas (UK) - Outlook for global cement markets 2019-22
Cemtech Europe 2018
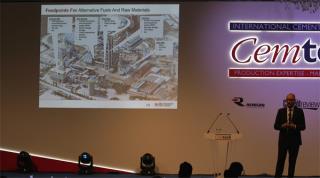
Oral Türesay, KHD Humboldt Wedag (Germany) - A new approach to burning alternative fuels
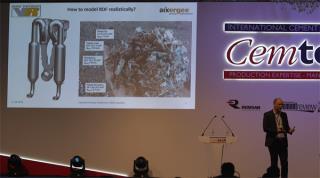
Matthias Mersmann, Aixergee GmbH (Germany) - Successful optimisation of a secondary-fuel-fired calciner – A case study.
Tim Hamer, Vecoplan (Germany) - Best practice preparation of refuse-derived fuel (RDF) for the calciner and main burner
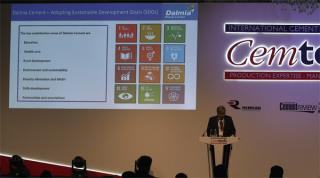
Ashwani Pahuja, Dalmia Cement (India) - Keynote on sustainable cement manufacturing.
Kerem Ersen, TCMA (Turkey) - The Turkish cement industry
Cemtech Asia 2018
Jim O’Brien, Jim O’Brien CSR Consulting (Ireland) - Turning sustainability into profitability in Vietnam, Cambodia, Laos and Thailand
Martin Pedersen & Stephen Farren, FLSmidth (Denmark) - Xuan Thanh case study
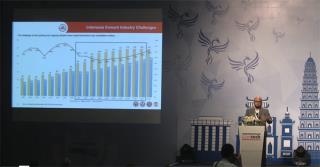
Adi Munandir, PT Semen Indonesia - Indonesian cement industry, opportunities and challenges.
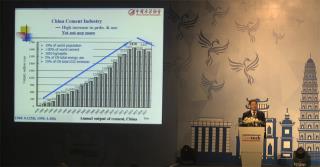
Dr Tongbo Sui, CCA (China) - Progressing towards a sustainable Chinese cement industry
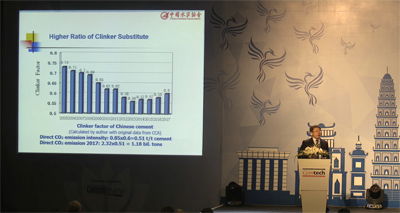
Dr Yourong Chen, Vice Chief Engineer, South Cement Co Ltd/CNBM Group (China) - Technology trends for energy saving and emissions reduction in China
Cemtech MEA 2018
Hamid Reza Tajik, Cement Industry Export Development Co. (Iran) - Iran export trade and internal market review
Steffen Dalsgaard Nyman, CC Jensen A/S (Denmark) - Increase uptime and reliability with oil contamination control
Mogens Juhl Føns, Fons Technology International (Turkey) - Cooler modernisation and performance upgrade
Dr Michael Enders, thyssenkrupp Industrial Solutions AG (Germany) - Quality control for a smooth kiln operation and good clinker quality
Robert Krist, FLSmidth Pfister (Germany) - Preparing for the future with alternative fuels
Luc Reibel, Walter Materials Handling / ATS Group (France) - Case studies: storage, extraction, dosing and feeding of shredded wood and tyres
Juliano Arantes, ABB (Switzerland) - How digitalisation helps to maximise alternative fuels in a cement plant
Nijat Orujov, VDZ (Germany) - Optimisation of the clinker burning process when using alternative fuels in cement kilns
Jim O’Brien, Jim O’Brien CSR Consulting (Ireland) - Turning sustainability into profitability in the Middle East
Hassan Tajeddin, Shargh White Cement Co, (Iran) - Paris agreement, Iran’s commitment and solutions
Dr Mathis Reichert, Loesche GmbH (Germany) - Successful scale-up into the unknown
Christian Altherr, Gebr Pfeiffer (Germany) - Implementation of two petcoke grinding units at RAK WCC plant
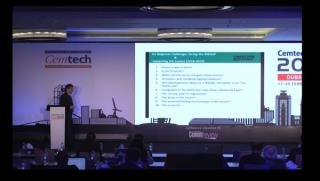
Adib El Hachem, Cimenterie Nationale SAL (Lebanon) - Market developments in the Levant and vertical integration strategies
Irfan Amanullah, Attock Cement - Pakistan’s high-growth market and industry expansion
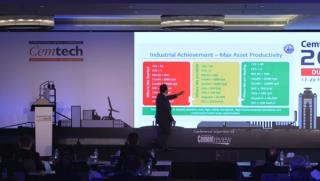
Amr Nader, Yanbu Cement (Saudi Arabia) - A journey of transformation towards sustained plant efficiency at Yanbu Cement
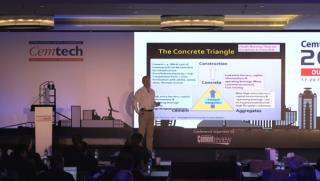
Peter Hoddinott, Independent Consultant (UK) - Marketing – strategies for entering new cement markets
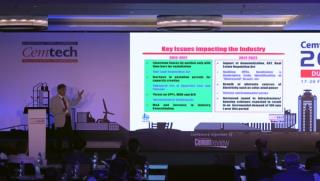
Saumen Karkun, Holtec Consulting (India) - Addressing the impact of external influences on performance outcomes
Olaf Michelswirth, Intercem Engineering (Germany) - Connecting Africa, grinding station and integrated logistics case study
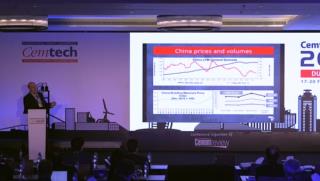
Tony Hadley, Tony Hadley African Advisory - Sub-Saharan Africa – M&A and corporate developments
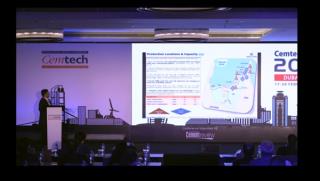
Syed Hasan, HBS Global (UAE) - Analysing the UAE cement industry – a review of supply & demand
Santhosh Balakrishnan, Riyad Capital (Saudi Arabia) - Saudi cement industry status and 2018 forecast
Hettish Karmani, U Capital (Oman) - GCC cement markets outlook
Cemtech Europe 2017
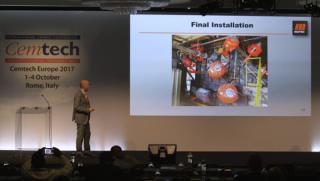
Matteo Manghi, Martin Engineering (Italy) - Advances in air cannon nozzles to improve pyroprocess performance.
Karsten Horn, INFORM GmbH (Germany) - From transportation to transformation – the rise of the digital workforce in cement logistics.
Brian Smith, N+P Alternative Fuels (UK) - Innovative technology for ESP and high temperature filtration upgrades.
Guido G Ceccherelli, EcosprayTechnologies Srl (Italy) - Innovative technology for ESP and high temperature filtration upgrades
Claus Fritze, Lechler GmbH (Germany) - Gas conditioning processes for the cement industry – high efficiency SNCR and gas cooling
Roberto Fedi, Teamnetwork Srl (Italy) - Meeting stringent NOx limits with innovative SCR technology.
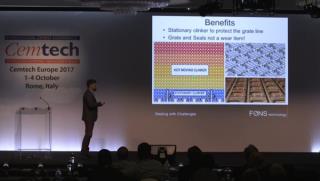
Firat Aslan, DAL Engineering Group (Turkey) - Working concept of the FONS Delta Cooler and DAL pyroprocess design
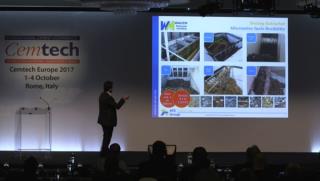
Basri Ogut, Walter Materials handling / ATS Group (France) - Best practices of alternative fuel dosing & feeding installations – case study
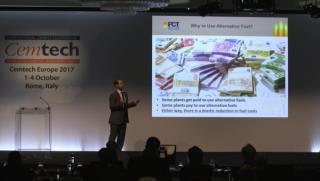
Joel Maia, FCT Combustion GmbH (Germany) - An alternative fuels programme - the model approach
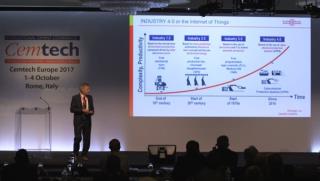
Gary Heath, Castolin Eutectic (Switzerland) - How the cement industry can benefit from Maintenance 4.0
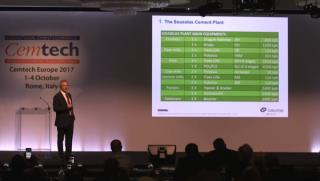
Francisco Leitão, Cimpor (Portugal) - Increasing thermal substitution with alternative fuels by waste pre-drying at the Souselas plant.
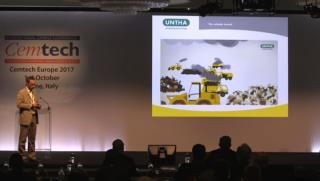
Daniel Wresnik, UNTHA shredding technology GmbH (Germany) - New trends in SRF production using single-step shredding solutions.
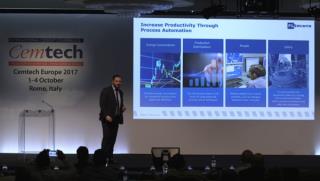
Ebrahim Honar, FLSmidth (Denmark) - Improving productivity through advanced process control system
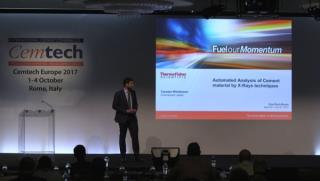
Carsten Wiedmann, Thermo Fisher Scientific (Germany) - New smart automation package for cement analysis.
Fabio Coletta, Whitehopleman (Italy) - Essential steps towards extending quarry life
Peter Hoddinott, Independent Consultant (UK) - CO2 reduction down the chain from clinker to concrete construction to energy-efficient buildings.
Daniele Gizzi, Environmental Manager, AITEC (Italy) - Sustainability and co-processing in the Italian cement sector
Jim O’Brien, Jim O’Brien CSR Consulting (Ireland) - Can the cement industry achieve its 2030 sustainability ambitions?
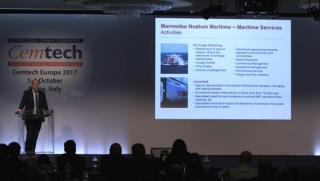
Joel Grau, Marmedsa Chartering (Spain) - Dry bulk freight markets
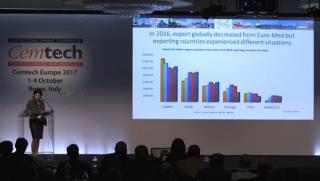
Sylvie Doutres, DSG Consultants (France) - Cement and clinker trade flows to/from Euro-Med countries
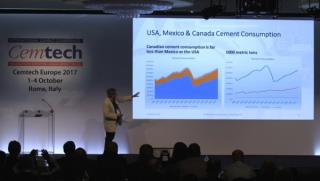
Rob Roy, ROI Economic Consulting (USA) - North American cement sector trends
John Fraser-Andrews, Global Equity Head of Building Materials, HSBC Bank Plc (UK) - World cement industry outlook
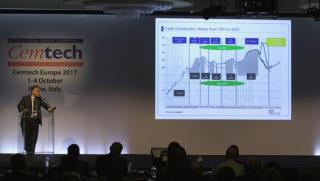
Giuseppe Schlitzer, CEO and General Manager, AITEC (Italy) - Italian Cement Sector
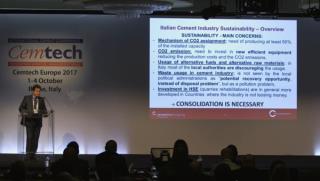
Paolo Bossi, CEO, Cementir Italia SpA (Italy) - Italian market overview
Cemtech Asia 2017
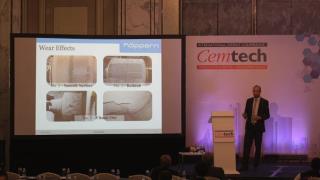
Yannic Sesemann, Köppern - Zero maintenance wear protection for roller presses.
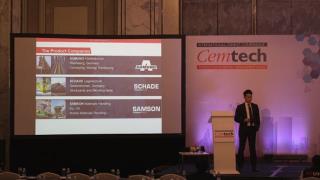
Alan Tran, Aumund Asia (Hong Kong) - Retrofit – the economical alternative to new investment on capital equipment.
Andreas Renetzeder, Scheuch (Austria) - Innovative SCR technologies for NOx, VOC, CO and odour reduction.
Siegfried Andräß, SICK AG (Germany) - Reducing cyclone blockages using hot wet process gas analysis - a case study
Yang Zhi, CBMI Construction Co Ltd / Sinoma Group (China) - EPC + value added services
Mogens Fons, Fons Technology (Turkey) - Innovative clinker cooling technology
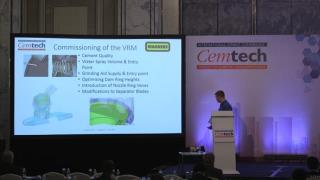
Boris Humpola and Mitchell D’Arcy, Wagners (Australia) - Pinkenba expansion project: installation and operation of a new vertical roller mill for cement and geopolymer raw materials production.
Christian Altherr and Phillip Hempel, Gebr Pfeiffer (Germany) - From small modular grinding units to extra-large VRM installations
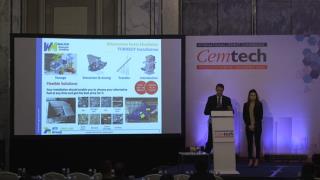
Somying Panyacheevita, SCG Group (Thailand) and Luc Rieffel, ATS Group (France) - Successful application of alternative fuels in clinker production.
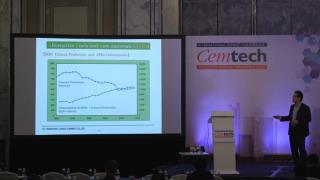
Tetsuo Yokobori, Sumitomo Osaka Cement Co Ltd (Japan) - Experiences of alternative fuels and raw material in Japan
Moises Nuñez, Cemengal (Spain) - Modular grinding system as a means of rapid expansion in Indonesia.
Ricardo Gonzalez, GlobBulk Consulting (Spain) - Low cost grinding plants and import terminal construction
Dr Joe Khor, CPB Engineering Sdn Bhd - The new CMS grinding station in Sarawak
Karsten Horn, INFORM GmbH (Germany)- The rise of the digital workforce in cement logistics
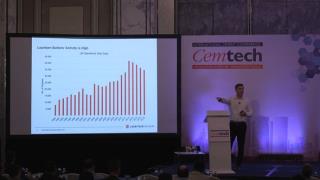
Owen Mulford, Lauritzen Bulkers (Singapore) - Dry bulk shipping and freight market – current and future trends
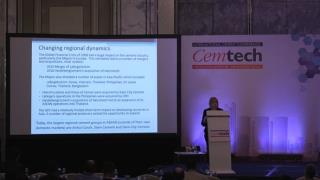
Marilyn Gardner, MGardner Consultancy (Australia) - Asia Pacific cement trade
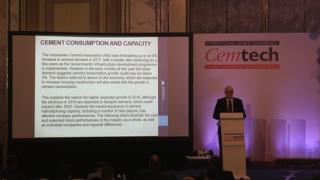
Martin Wilkes, Marandale Asia (Indonesia) - The changing cement industry scene in Indonesia
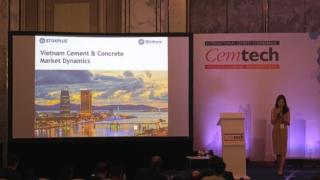
Lan Nguyen, Stoxplus - Vietnam cement sector
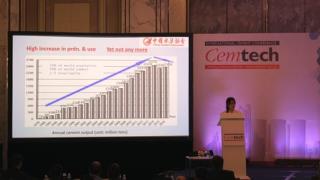
Grace Chen, Vice Director, China Cement Association - Overview of the cement industry in China
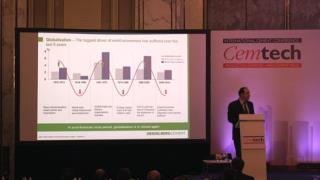
Emir Adiguzel, CEO, HeidelbergCement Trading (Germany) - Winds of change in the world cement industry
Cemtech MEA 2017
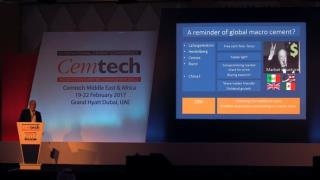
Tony Hadley, Baobab Advisory (France) - Cement in Africa – calm after the storm?
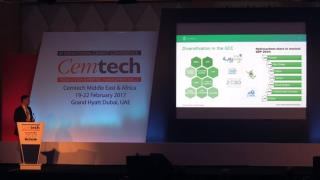
Matthias Herles, IHS Markit (Germany) - GCC Construction Outlook: diversification, mega-projects and financial deficits.
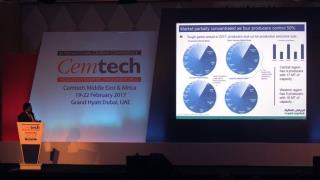
Santhosh Balakrishnan, Riyad Capital - Saudi Arabia’s cement sector, demand drivers and market outlook.
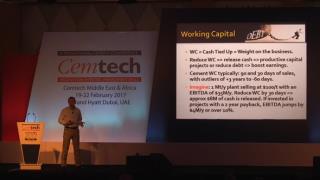
Peter Hoddinott, Independent Consultant (UK) - Optimising your cement business: working capital reduction strategies
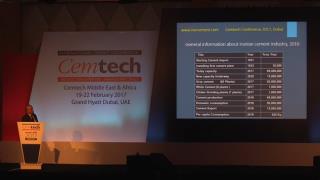
Dr Lotfali Bakhshi, Iran Cement - New trends in the Iranian cement industry
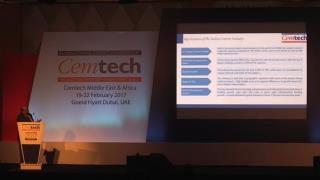
Alok Agarwal, Birla Corp Ltd (India) - Industry consolidation in India and market outlook
Jim O’Brien, Jim O’Brien CSR Consulting (Ireland) - Excellence in sustainability, excellence in profitability
Dr Suchismita Bhattacharya, Ercom Engineers Pvt Ltd (India) - Using less clinker: the role of slag and fly ash cements in the Middle East.
Fernando Dueñas, Cemengal (Spain) - Innovative solutions for a quick penetration strategy into booming cement markets.
Jawad Baidari, Beumer (Germany) - Alternative fuel handling systems: two case studies.
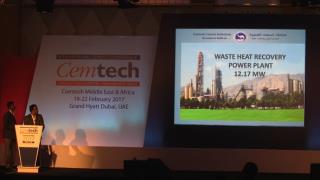
S Raja and V Murthy, Fujairah Cement Industries (UAE) - 12MW waste heat recovery power plant: a performance review.
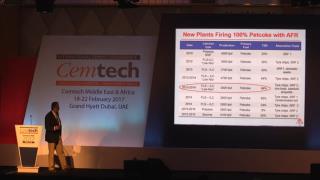
Tahir Abbas, Cinar (UK) - Alternative fuels from preparation to combustion: MENA case studies.
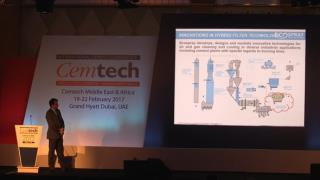
Marco Rovetta, Ecospray Technologies Srl (Italy) - Innovations in hybrid filter technology.
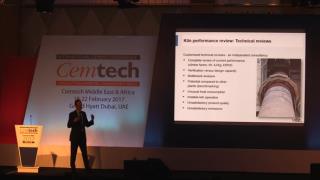
Volker Hoenig, VDZ gGmbH (Germany) - Kiln reviews to improve efficiency, output and production costs.
Mogens Fons, Fons Technology International (Turkey) - Clinker cooler retrofit case studies.
Dr Gary Heath, Castolin Eutectic (Switzerland) - Advanced solutions to control wear and corrosion in the cement plant
Philippe Lavech du Bos, Anivi (Spain) - How to ensure short paybacks in niche markets.
Patrick Heyd, Gebr Pfeiffer SE (Germany) - Latest experiences with MVR mills
Jaber Malandi, Bedeschi (Italy) - Cement and clinker export terminals: case studies from Turkey, Tunisia and Greece.
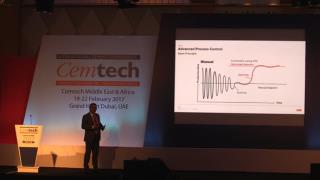
Juliano Arantes and Osman Nemli, ABB (Switzerland) - Bursa Çimento improves energy and process efficiency with ABB’s Expert Optimizer.
Mohammad Mehdi Khouzestani, Namadin Sanat Co (Iran) - Control systems: improving ball mill energy efficiency.
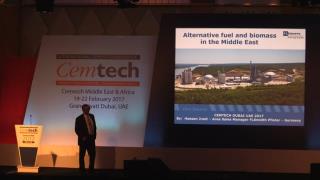
Hassan Jradi, FLSmidth Pfister (Germany) - Alternative fuel and biomass in the Middle East.
Cemtech Europe 2016
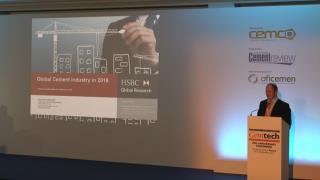
John Fraser-Andrews, Director of Equity Research, HSBC Bank plc (UK) - Overview of the global cement sector in 2016
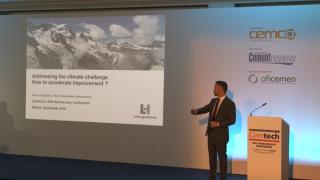
Bernard Mathieu, Head of Sustainability, LafargeHolcim (Switzerland) - Addressing climate change and the role of the cement industry in accelerating improvements
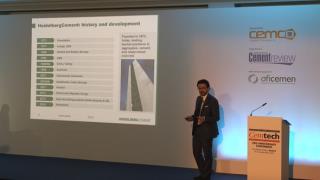
Francesco Brambilla, Director of Sales , HeidelbergCement AG - Mediterranean Basin and Africa: future expectations and existing bottlenecks.
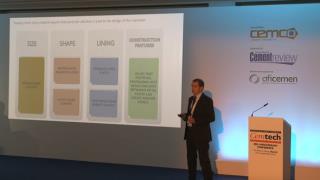
Fabio Chignoli, Bedeschi, (Italy) - Crushing and handling sticky materials: case studies from Russia and Turkey.
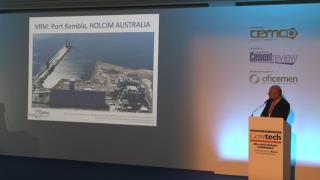
Fernando Dueñas, Cemengal, (Spain) - Grinding capacity increase for new and existing plants: real case scenarios
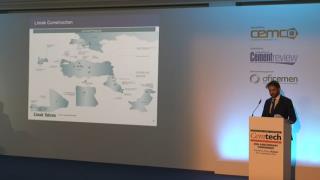
Erkam Kocakerim Limak Cement Group (Turkey) - The Limak perspective in Africa.
Joel Grau, Marmedsa Chartering (Spain) - Dry bulk freight markets.
Javier Martinez, Global Bulk Technologies (Spain) - Cement terminal design and investment strategies.
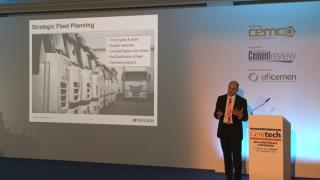
Karsten Horn, INFORM (Germany) - Cement distribution network planning - asset or burden?
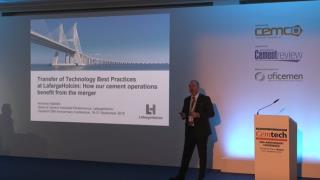
Andreas Halbleib, Head Cement Industrial Performance, LafargeHolcim (Switzerland) - Technical Keynote: Transfer of best practices at LafargeHolcim
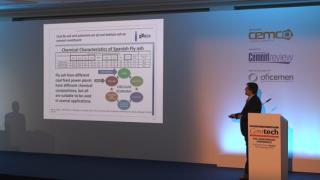
Dr Miguel Angel Sanjuan, IECA/Oficemen (Spain) - Coal fly ash and use of coal bottom ash as cement constituent
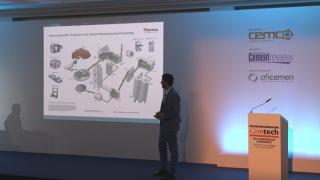
C. Wiedmann, Thermo Fisher Scientific - Real-time X-ray diffraction and applications in the cement industry.
Dean Tosic, Climeon (Sweden) - Getting (more) value from your waste heat
S Thattey, Birla Co Ltd (India) - Case study: sustainable biomass generation and co-processing
M. Akritopoulos, Cinar (UK), Alternative fuel utilisation technologies
Neville Roberts, N+P (UK) - Co-milling of alternative fuels
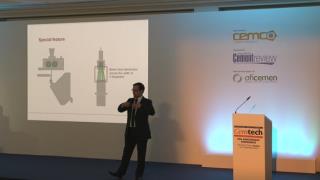
Stefan Seeman, KHD (Germany) - Roller press systems for energy-efficient grinding.
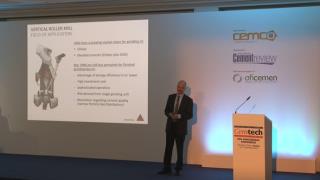
Matthias Dietrich, Sika Services AG (Switzerland) - Improved efficiency of VRMs with grinding aids.
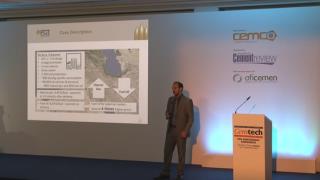
Calciner case study: advanced tools for fuel and production optimisation - Joel Maia, FCT Combustion
Cemtech Asia 2016
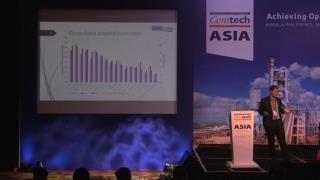
Worldwide cement industry trends and forecast to 2018 - David Bowers, ICR Research (UK)
Opportunities for investors in the Vietnam cement industry - Lan Nguyen, StoxPlus Corporation
Boosting capital efficiency in the cement industry - Peter Hoddinott, Independent Consultant (UK)
The cement sector in Myanmar: industry survey and project review - Soe Naing, KBZ Industries Ltd (Myanmar)
Alternative raw materials & composite cement strategies - Dr Hans-Wilhelm Meyer, CEMCON AG (Switzerland)
Global leaders in sustainability performance - Jim O’Brien, Jim O’Brien CSR Consulting (Ireland)
Latest innovations to optimise a new grinding plant project - Moises Nuñez, Cemengal (Spain)
Grinding systems and cement composition optimisation: cement additives added value - Laurent Guillot, CHRYSO (France)
Energy efficient technologies for the cement industry - Andrew Wilson, ABB Switzerland Ltd (Switzerland)
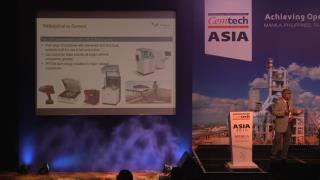
CNA real-time online analysers: benefits in the cement process - Rajendra Mishra, PANalytical BV
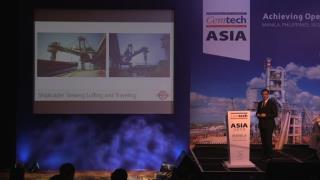
Bulk loading operations: different loaders for various vessels - Michele Gatto, Bedeschi Spa (Italy)
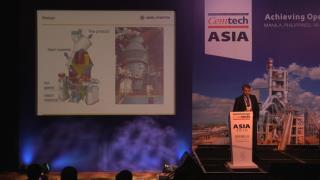
Pfeiffer mills with MultiDrive - Phillip Hempel, Gebr. Pfeiffer SE (Germany)
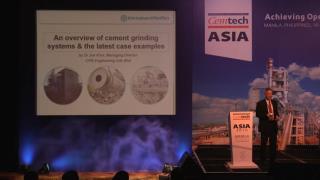
Cement grinding systems and the latest case studies - Dr Joe Khor, CPB Engineering Sdn Bhd (Malaysia)
Developing a cost-effective fuel switching capability - Tahir Abbas, Cinar Ltd (UK)
Successful applications using alternative fuels in the Philippines - Dominador A Reyes & Luc Reibel, Holcim Philippines/Walter Materials Handling (Philippines/France)
Alternative fuel systems at Aalborg Portland Cement, Denmark - Macario Yap, BEUMER Co Ltd (Thailand)
Large clinker coolers in Asia: first operational experiences - Justus von Wedel, IKN GmbH (Germany)
Setting new standards for clinker cooler: Fons Delta Cooler - Ugras Akay, FONS Technology International (Turkey)
Innovative SCR technologies for NOx, VOC, CO and odour reduction - Andreas Renetzeder, Scheuch GmbH (Austria)
Leading Philippines' to a low-carbon operative model - Ernesto Felix, VP Operations & Technology, Cemex
Overview of Korean cement markets: Kim Jae Young, Tallship Trading (Korea)
Truck dispatch automation: optimising logistics with IT - Marc Brida, Fritz & Macziol GmbH (Germany)
Cemtech MEA 2016
Magnesita refractory bricks for the cement industry - Eduardo Matos, Magnesita (Brazil)
Advanced composite and wear solutions for the global cement industry - Kevin Venter, Sila (Australia)
Retrofit of bucket elevator at Yamama Cement - Bilal Jabboul, Beumer Group (Germany)
Iranian White Cement industry - Behrooz Zandi, Managing Director, Shargh White Cement Co (Iran)
Fons Delta Cooler - modern cooler technology - Mogens Fons, Fons Technology International (Turkey)
Plant performance optimisation - filtration at high temperature without the use of water - Thomas Wyen, Ecospray Technologies Srl (Italy)
Increasing efficiency in cement production using precast refractory solutions - Harpreet Singh, Hasle Refractories A/S (Denmark)
Emission reduction through kiln optimisation and control techniques - Dr Suchismita Bhattacharya, Ercom Engineers (India)
Supporting economic growth while lowering environmental footprint - Michael Olsen, FLSmidth (Kenya)
Utilisation of AFs from various waste streams in the production process of high quality clinker - Stelios Sycopetrides & Dr Iacovos Skourides, Vassiliko Cement (Cyprus)
Approaches to higher alternative fuel utilisation and the impact on the pyro process - Michael Suppaner, A TEC Production & Services GmbH (Austria)
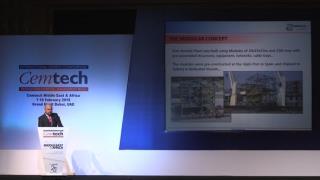
Grinding plant design, engineering, delivery and installation - Fernando Duenas Pozo, Cemengal (Spain)
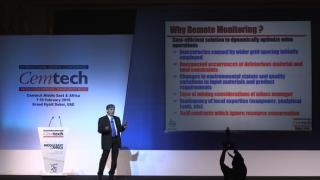
Remote monitoring of limestone quarries to extend resource life - Saumen Karkun, Holtec Consulting (India)
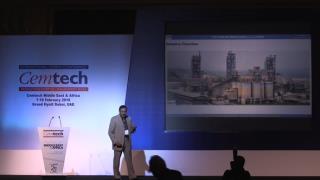
EPC cement project management - critical factors for decision making - Rabi Das Gupta, ETA Star International LLC (UAE)
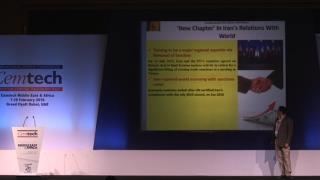
Iranian exports and a new international cement standard - Hamid Reza Tajik, Fars & Khuzestan Cement Holding/ISIRI TC74-ISO (Iran)
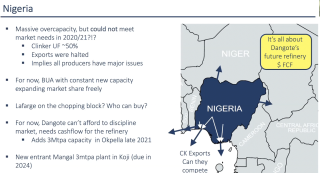
Prospects and challenges of the Nigerian cement industry - the BUA experience - Yusuf Binji, BUA Cement (Nigeria)
Modernisation of the Rwandan cement sector - new plant construction and country outlook - Busisiwe Legodi, CIMERWA (Rwanda)
Overview of the East Africa cement market - Francis Mwangi, Standard Investment Bank (Kenya)
The cement markets of Lebanon and Syria - Adib El Hachem, Cimenterie Nationale SAL (Lebanon)
Yanbu Cement Company - 35 years of Evolution - Dr Ahmed Zugail and Kalyan Bose, Yanbu Cement Co (Saudi Arabia)
Pakistan cement sector and regional export market challenges: Irfan Amanullah, Attock Cement (Pakistan)
Building a self-sufficient cement industry in Africa - Onne Van der Weijde, CEO, Dangote Cement (Nigeria)
Overview of the global cement sector in 2016 - John Fraser-Andrews, HSBC Bank Plc (UK)
Cemtech Americas 2015
Bulk storage: too big to fail? - Gerard Lynskey, SSI Consulting (USA)
Dry as a bone – packaging dry cement premixes in PE film - Trevor Mitford, Concetti Group (USA)
Florida mercury control options - Alvaro Linero, PE, Koogler & Associates (USA)
Utilising dry sorbent injection technology to improve acid gas control for cement plant regulatory compliance - Gerald Hunt, Lhoist North America (USA)
Latest perspectives on the US environmental regulatory front - Carrie Yonley, Schreiber, Yonley & Associates (USA)
The evolution of alternative fuel production in the United States - Edward Morton, VP, Evolution Environmental (USA)
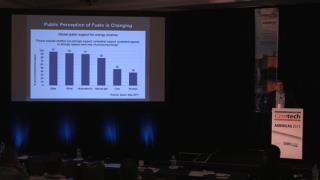
A strategic approach to alternative fuel utilisation - John Kline, Kline Consulting (USA)
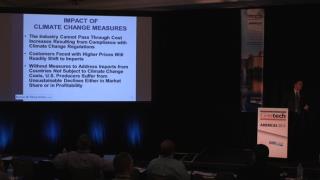
Climate change and regulatory developments in California: what are the implications for the North American cement industry? - Josh Snead, King & Spalding (USA)
Energy performance best practice at Union Bridge - Jeff Hook, Lehigh Cement (USA)
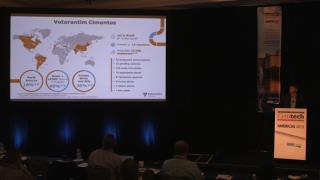
Approaches to CO2 reduction in Brazil - Luiz Germano, Votorantim Cimentos (Brazil)
Global packaging innovations in cement - David Khanna, BPI.Visqueen (UK)
Fons Delta Cooler – breaking new world records. - Cenk Alpaslan, DAL Engineering Group / FONS Technology International (Turkey)
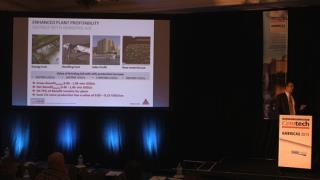
Enhanced plant profitability with chemical additives - Jorg Schrabback, Sika Services AG (Germany)
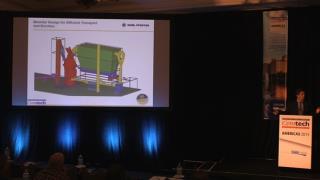
The benefits of mini-modular mills - Chris Oesch, President, Gebr Pfeiffer, Inc (USA)
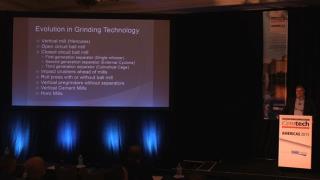
Current and future grinding technologies and techniques - John Kline, Kline Consulting (USA)
Case study – construction of the Piura greenfield integrated cement works - Juan Teevin, Cementos Pacasmayo (Peru)
Latin American cement markets - Francisco Suarez, Scotiabank (Mexico)
Outlook for the US cement industry - Rob Roy, ROI Economic Consulting (USA)
Americas construction outlook: a North/South divide - Scott Hazelton, IHS Economics (USA)
Keynote address: Florida Cement Markets - Cary Cohrs, President, American Cement Company and former PCA Chairman (USA)
Cementing our role in the low carbon future – lessons from Canada: Michael McSweeney, President and CEO, Cement Association of Canada
Cemtech Europe 2015
CO2 mitigation levers and utilisation in the cement industry: Michel Gimenez, LafargeHolcim CIP (France)
Advanced SCR and SNCR technologies for NOx, CO, VOC: Georg Lechner, Scheuch GmbH (Austria)
High temperature clinker cooler gas filtration without water injection: Thomas Wyen, Ecospray Technologies (Italy)
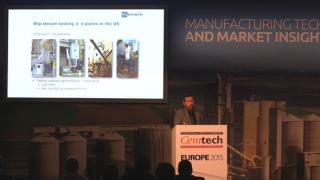
Solutions for catalytic filtration in the cement industry: Presented by: Pietro Aresta, FLSmidth (Denmark)
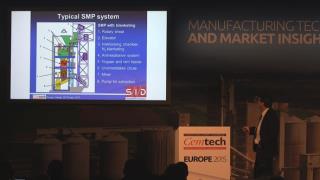
Alternative fuels: SMP system for feeding pasty fuels to cement kilns: Donat Bösch, SID SA (Switzerland)
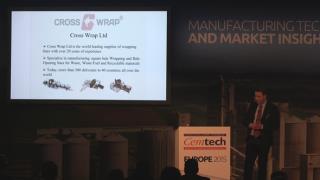
Wrapped bales – solutions for SRF/RDF handling, transportation and storage: Heikki Jyrkinen, Crosswrap (Finland)
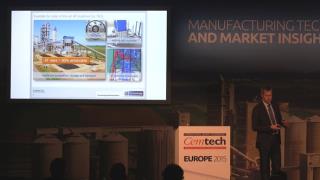
Prepol Step Combustor – a simple combustion system for alternative fuels: Sebastian Frie, ThyssenKrupp Industrial Solutions AG (Germany)
Pelletised SRF fuel in Europe: Neville Roberts, N P Recycling (UK)
Scalable sampling solutions for in-process particle size monitoring: Stuart Barton, Xoptix (UK)
Alternate fuel and raw material utilisation in the Russian cement industry: Jaroslav Stoupa, Eurocement (Russia)
Advanced cement grinding with ‘reduced circuit’: Florian Grassl, PM-Technologies GmbH (Austria)
Expansion of 1000tpd white cement kiln and innovative clinker handling system: Naseer Siddiqui, Saudi White Cement (Saudi Arabia)
State-of-art cement grinding technology: from micro to macro scale: Marco Goisis, Italcementi SpA (Italy)
The wet to dry conversion of Akmenes Cementas: Pietro De Michieli, Bedeschi / CTP (Italy)
The premiumisation of cement: David Khanna, BPI Visqueen (UK)
Alternative fuels handling: Wolfgang Schulte, BEUMER Group (Germany)
Transport logistics – optimising truck productivity and haulier payment schemes: Karsten Horn, INFORM GmbH (Germany)
Financing low carbon cement production in emerging markets: Florence Bachelard-Bakal, EBRD (UK)
A new solution for Mercury - Emission Reduction in the Cement Industry: Michael Suppaner, A TEC (Austria) & Georg Lechner, Scheuch GmbH (Austria).
Eastern European and CIS construction and cement markets: Bartlomiej Sosna, PMR (Poland)
Key developments in the Austrian cement industry: Dr Felix Papsch, Association of the Austrian Cement Industry (Austria)
HeidelbergCement’s endeavours in AFR and carbon capture and utilisation: Jan Theulen, Global Director Alternative Resources, HeidelbergCement (Belgium)
European Union economics and the disconnect between the Northern and Southern construction markets: Dasha Lukiniha, IHS (UK)
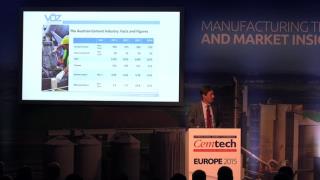
Opening address for Cemtech Europe 2015: Sebastian Spaun, Managing Director, Association of the Austrian Cement Industry (Austria).
Cemtech Asia 2015
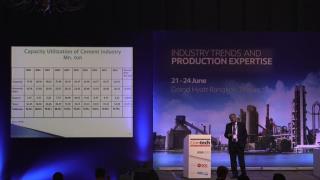
Alternative fuels: technology, performance and challenges: Dr Arif Bashir, DG Khan (Pakistan)
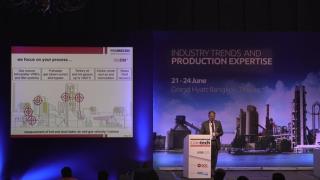
Cost reduction through optimised air and gas flows in cement production: Dirk Schmidt, Promecon, (Germany)
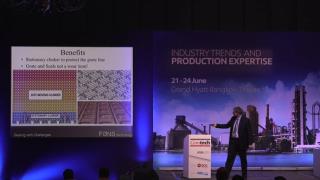
The Mardin Cement 4000tpd clinker cooler retrofit - breaking a new world record with the FONS Delta Cooler: Mogens Fons, Fons Technology International (Turkey)
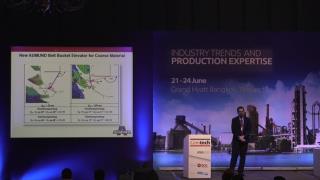
Palletless packaging systems – Southeast Asian case studies: Soravudh Chotivanich, Beumer Group (Germany)
The next generation in advanced technologies for emission reduction, EMC+, SCR and DeCONOx: Andreas Renetzeder, Scheuch GmbH (Austria)
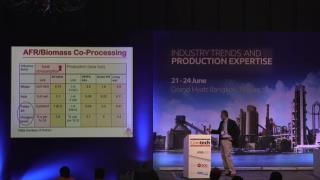
Maximising the thermal substitution rate of alternative fuels in kiln and calciners: Tahir Abbas, Cinar (UK)
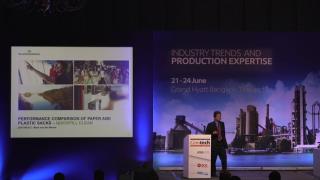
Performance comparison of paper and plastic sacks: Mark Van Der Merwe, Billerud Korsnas (Sweden)
Optimised transport planning: reducing truck fleet costs and gate congestion: Karsten Horn, INFORM GmbH (Germany)
Covering existing stockpiles: Roel Castano, Geometrica (USA)
New high capacity bucket elevator developments: Fernando Libonati, Aumund (Germany)
Controlling particle size distribution for increased grinding efficiency: Stuart Barton, Xoptix (UK)
User experiences of VRM grinding and optimisation at Indocement: Jean-Marc Reginster, HeidelbergCement Technical Centre (Indonesia)
Additives for competitive limestone cement in Asian markets: Jorg Schrabback, Sika Services AG (Germany)
Financing cement in emerging markets, Eric Siew, IFC (Hong Kong)
21MW Waste heat recovery system for Pukrang cement plant: Hakan Uvez, Asia Cement PLC (Thailand)
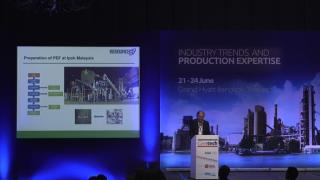
Challenges in developing a refuse-derived fuel for cement kilns in Southeast Asia from local waste: Brian McGrath, ResourceCo Asia (Singapore)
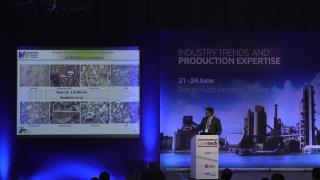
Successful AF systems for RDF, rice husks and shredded tyres: Luc Rieffel, Walter Materials Handling / ATS Group (France).
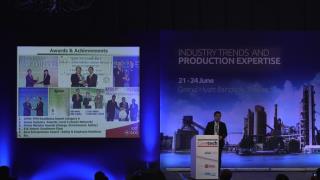
SCG’s Lampang plant: a role model for sustainable development in business operation: Poramen Pradaphon, Siam Cement Lampang (Thailand).
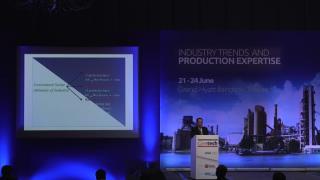
Myanmar emerges – cement market and project developments: Soe Naing, KBZ Industries (Myanmar)
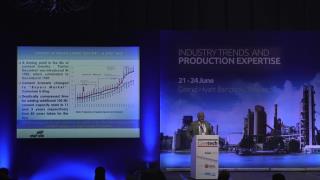
Indian cement industry – present status and the way forward: Dr SK Handoo, Cement Manufacturers’ Association of India (India)
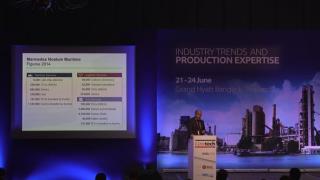
Dry bulk freight rates and trends in clinker & cement trading: Joel Grau Lara, Marmedsa Chartering (Spain)
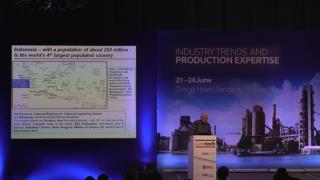
Indonesia’s cement industry 2015 and beyond: Randolph Wintgens, Wintgens Associates (Indonesia)
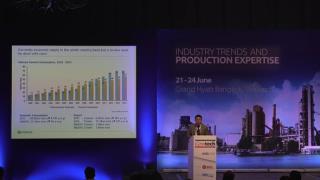
Prospects for the Vietnam cement industry: Thuan Nguyen, StoxPlus Corp (Vietnam)
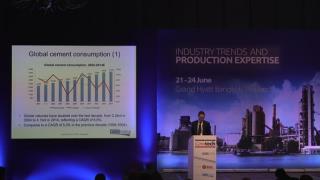
Worldwide cement market trends: Thomas Armstrong, Managing Editor, International Cement Review (UK)
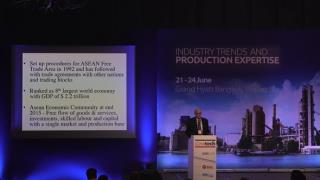
A review of ASEAN cement markets: Martin Wilkes, Independent Consultant (Indonesia)
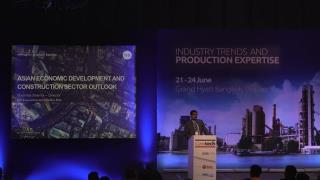
Asian economic development and construction sector outlook: Soumitra Sharma, IHS (Singapore)
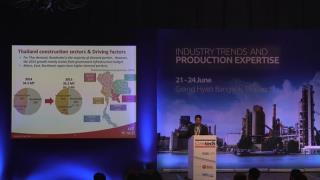
Thailand cement market – growth and sustainability: Nithi Patarachoke, Vice President: SCG Cement – Building Materials (Thailand)
Cemtech MEA 2015
High efficiency cement cooling for cement milling: Nick Sutherland, Solex Thermal Science Inc (Canada)
Different approaches to applying O&M services: Hossam Darwish, ASEC Engineering (Egypt)
Efficient kiln seals – a strategic component for kiln optimization:Yoann Picard, Iteca Socadei SAS (France)
Greenfield and plant expansion and upgrade projects: Nouran Yaghchi, Whitehopleman (UK)
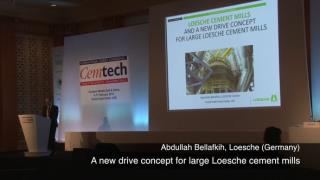
A new drive concept for large Loesche cement mills: Abdullah Bellafkih, Loesche (Germany)
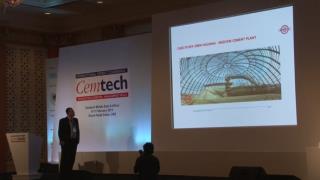
Continuous loading of dry bulk cargo into ocean-going vessels – the Medcem case study: Jaber Malandi, Bedeschi (Italy)
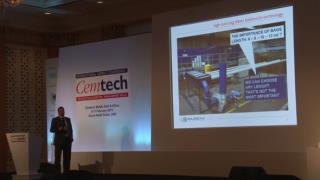
New bag house filtration for improved emission control – an Egyptian case study: Salvatore Gallo, Boldrocchi (Italy)
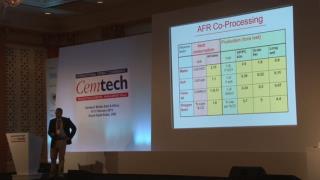
Low-cost solutions for increasing production with alternative fuels: Tahir Abbas, Cinar Ltd (UK)
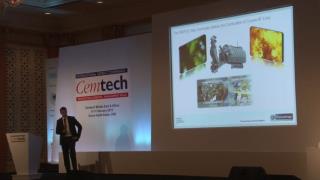
Advanced combustion technology for low grade and course alternative fuels: Sebastian Frie, ThyssenKrupp Industrial Solutions AG (Germany)
Doloma brick – an affordable refractory to line the central burning zone of rotary cement kilns: Eduardo Reis, Magnesita (Brazil)
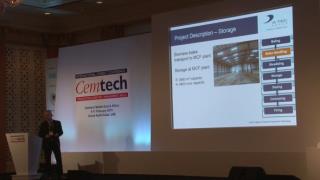
Part 2: First large-scale biomass preparation and firing at Messebo Cement: Michael Suppaner, A TEC (Austria)
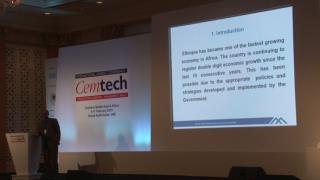
Part 1: First large-scale biomass preparation and firing at Messebo Cement: Getachew Okbay, Messebo Cement Factory PLC (Ethiopia)
Switching to solid fuels in cement plants – technical solutions and case studies: Suchismita Bhattacharya, Penta India Cement & Minerals Pvt. Ltd (India)
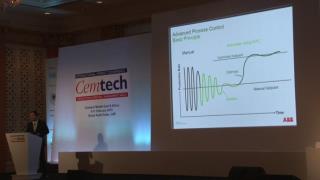
Use of advanced process control for the optimisation of the modern cement plant: Juliano Arantes, ABB (Switzerland)
Innovative techniques adopted by DG Khan for alternative fuels and waste heat recovery: Dr Arif Bashir, DG Khan (Pakistan)
VRM technology past, present and future: Carsten Schoessow, Gebr Pfeiffer (Germany)
Sourcing, transport and use of fly ash and GGBFS in GCC countries: Jochen Pfitzner, Hawar Power Minerals (Qatar)
Bagging and packaging solutions for worldwide markets - Sharif Wardeh, Beumer Group (Germany)
Focus on the worldwide cementitious materials trade, supply & demand: Gareth Ward, ZAG International (US)
Clinker grinding at Guinea’s largest plant: Philippe Zacca, Guinea Industries Ciments / Bulk Group (Lebanon)
Upgrade & new plant projects across the MENA region: Luc Rudowski, Polysius SAS/ThyssenKrupp (France)
Growth & opportunity in Africa – what does history tell us? Tony Hadley, Baobab Advisory (France)
The impact of falling oil prices on the UAE cement industry: Harpreet Duggal, Black Rock Cement (UAE)
GCC cement sector outlook – Hettish Karmani, Global Investment House
